


Sandra Rendgen
History of Infographics
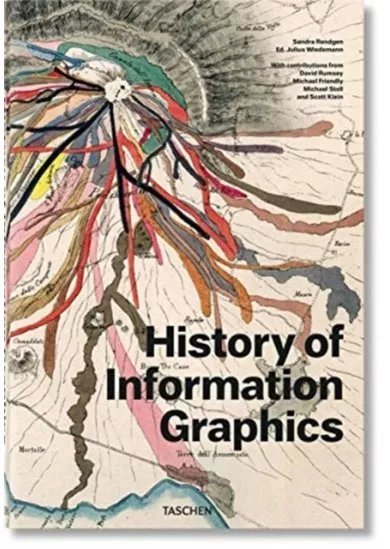
From cosmic charts and da Vinci's Vitruvian Man to the New York subway map: trace the history of visual data from the Middle Ages to the digital era in this XL compendium. Featuring some 400 infographic milestones across technology, cartography, zoology, In the age of big data and digital distribution, when news travel ever further and faster and media outlets compete for a fleeting slice of online attention, information graphics have swept center stage. At once nuanced and neat, they distill abstract ideas, complex statistics, and cutting-edge discoveriesinto succinct, compelling, and masterful designs. Cartographers, programmers, statisticians, designers, scientists, and journalists have developed a new field of expertise in visualizing knowledge.This XL-sized compendium explores the history of data graphics from the Middle Ages right through to the digital era. Curated by Sandra Rendgen, some 400 milestones span astronomy, cartography, zoology, technology, and beyond. Across medieval manuscripts and parchment rolls, elaborate maps, splendid popular atlasses, and early computer-based information design, we systematically break down each work’s historical context, including such highlights as Martin Waldseemüller’s famous world map, the meticulous nature studies of Ernst Haeckel, and many unknown treasures.Hot on the heels of the best-selling Information Graphicsand Understanding the World, this third volume fills the gap as an unprecedented reference book for data freaks, designers, historians, and anyone thirsty for knowledge. An enthralling exploration into the teachings, research, and lives of generations past.The author Sandra Rendgenstudied art history and cultural studies in Berlin and Amsterdam. Her work both as an editor and in developing concepts for media installations concentrates at the interface between image culture and technology, with a particular focus on data visualization, interactive media and the history of how information is conveyed. She is the author TASCHEN’s Information Graphicsand Understanding the World.The editor Julius Wiedemannstudied graphic design and marketing and was an art editor for newspapers and design magazines in Tokyo before joining TASCHEN in 2001. His titles include the Illustration Now!and Record Coversseries, as well as the infographics collection and books about advertising and visual culture.
From cosmic charts and da Vinci's Vitruvian Man to the New York subway map: trace the history of visual data from the Middle Ages to the digital era in this XL compendium. Featuring some 400 infographic milestones across technology, cartography, zoology, In the age of big data and digital distribution, when news travel ever further and faster and media outlets compete for a fleeting slice of online attention, information graphics have swept center stage. At once nuanced and neat, they distill abstract ideas, complex statistics, and cutting-edge discoveriesinto succinct, compelling, and masterful designs. Cartographers, programmers, statisticians, designers, scientists, and journalists have developed a new field of expertise in visualizing knowledge.This XL-sized compendium explores the history of data graphics from the Middle Ages right through to the digital era. Curated by Sandra Rendgen, some 400 milestones span astronomy, cartography, zoology, technology, and beyond. Across medieval manuscripts and parchment rolls, elaborate maps, splendid popular atlasses, and early computer-based information design, we systematically break down each work’s historical context, including such highlights as Martin Waldseemüller’s famous world map, the meticulous nature studies of Ernst Haeckel, and many unknown treasures.Hot on the heels of the best-selling Information Graphicsand Understanding the World, this third volume fills the gap as an unprecedented reference book for data freaks, designers, historians, and anyone thirsty for knowledge. An enthralling exploration into the teachings, research, and lives of generations past.The author Sandra Rendgenstudied art history and cultural studies in Berlin and Amsterdam. Her work both as an editor and in developing concepts for media installations concentrates at the interface between image culture and technology, with a particular focus on data visualization, interactive media and the history of how information is conveyed. She is the author TASCHEN’s Information Graphicsand Understanding the World.The editor Julius Wiedemannstudied graphic design and marketing and was an art editor for newspapers and design magazines in Tokyo before joining TASCHEN in 2001. His titles include the Illustration Now!and Record Coversseries, as well as the infographics collection and books about advertising and visual culture.
| Nyelv | angol |
| Kiadó | Taschen GmbH |
| Oldalak száma | 462 |
| Kötés típusa | Hardback |
| Súly (g) | 3794 g |
| Méretek (Sz-M-H) | 375 x 258 x 50 |
| EAN | 9783836567671 |
| Szállítási idő | Nem elérhető |
További termékek a kategóriából:


